Heiken Ashi Exit Indicator
Indicator EA template available
Section titled “Indicator EA template available”An EA template is available for this indicator. Add a new EA to your account and choose the template matching the name of this indicator.
The Heiken Ashi Exit Indicator
Section titled “The Heiken Ashi Exit Indicator”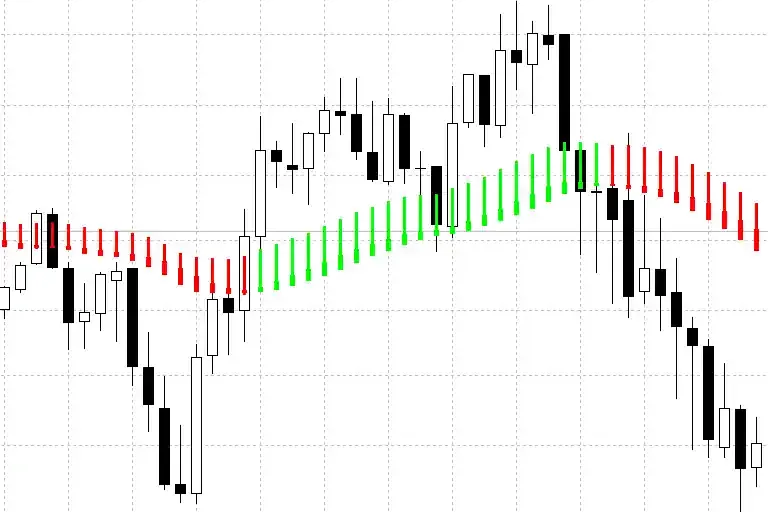
The Heiken Ashi Exit Indicator helps determine the trend’s direction by drawing Heiken Ashi candles. These candles are different from traditional candles as they take an average of the price movement and stay green in an uptrend and red in a downtrend. The indicator plots Heiken Ashi candles over the candlesticks as a moving average, indicating strong bullish or bearish momentum.
Using the Indicator
Section titled “Using the Indicator”The indicator provides BUY/SELL signals when it changes to green or red. Green indicates an uptrend, while red suggests a downtrend. It also gives clear exits and potential trend reversals. For example, if the long-term trend is upward, a trend reversal trade can be taken by entering the red Heiken Ashi candle. However, during consolidation periods, the indicator may consistently plot green and red candles, so using another indicator alongside can help filter false signals.
Considerations
Section titled “Considerations”Applying the Heiken Ashi Exit Indicator on longer timeframes is recommended to minimize repainting issues.