QQE Indicator
Esta página aún no está disponible en tu idioma.
Indicator EA template available
Section titled “Indicator EA template available”An EA template is available for this indicator. Add a new EA to your account and choose the template matching the name of this indicator.
What is QQE Indicator?
Section titled “What is QQE Indicator?”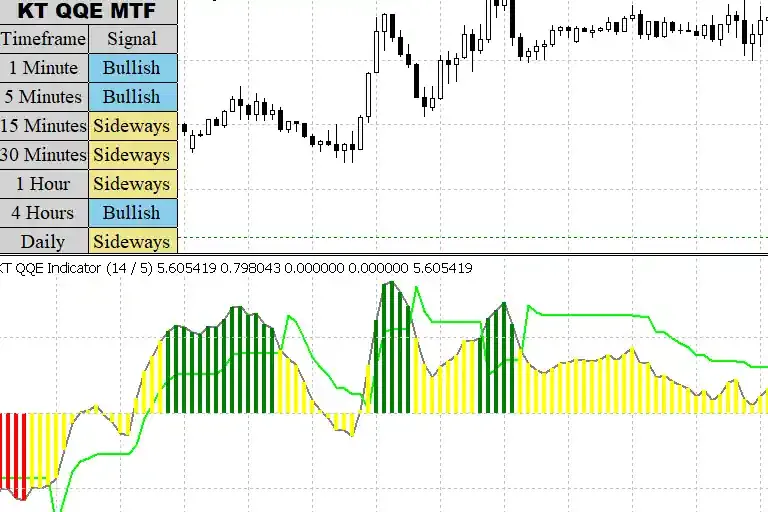
QQE is an abbreviation for the Qualitative Quantitative Estimation. The indicator is based on RSI enhanced using a smoothing technique. It has withstood the test of time and has no lag, making it reliable.
Determining the Trend
Section titled “Determining the Trend”The indicator can be used to determine the trend. If it is above the 10 level, it indicates an ascending/bullish market. You can use it as a trade filter by opening a long position when it is above 10 and a short position for lower values.
Identifying Overbought and Oversold Positions
Section titled “Identifying Overbought and Oversold Positions”When the indicator surpasses the 12+ levels, it indicates an overbought position and a potential long opportunity. Similarly, negative values suggest an oversold position and a potential short opportunity.
Detecting Price and Momentum Divergence
Section titled “Detecting Price and Momentum Divergence”The QQE indicator can help detect divergence between price and momentum. Bullish divergence occurs when the indicator sets higher lows while prices form lower lows, indicating a potential bullish reversal. Bearish divergence occurs when the indicator forms lower highs while prices set higher highs, indicating a potential bearish reversal.
Crossing of Signal Lines
Section titled “Crossing of Signal Lines”When the bold line crosses the trailing line, it indicates changing momentum. The bold line crossing above the slow trailing line suggests bullish momentum, while the smooth line crossing below the trailing line indicates short-term downside momentum.
Conclusion
Section titled “Conclusion”The QQE indicator is highly accurate and offers various strategies for buy and sell signals. It helps detect trend reversals and enter trades at optimal positions. Consider including it in your trading strategy.